BMI Calculator
years
pound
ft
in
23
Normal
Underweight
(<18.5) Normal
(18.5-24.9) Overweight
(25-29.9) Obesity
(30+)
(<18.5) Normal
(18.5-24.9) Overweight
(25-29.9) Obesity
(30+)
Detailed Results
BMI:
23 kg/m²
Healthy BMI range:
18.5 kg/m² - 25 kg/m²
Healthy weight for your height:
128.9 pounds - 174.2 pounds
BMI Prime:
0.92
Ponderal Index:
12.9 kg/m³
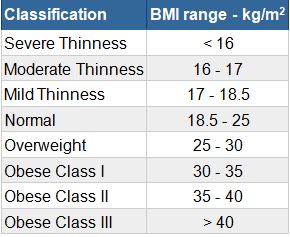
BMI Categories
| BMI | Weight Status |
|---|---|
| Below 16 | Severe Thinness |
| 16 - 17 | Moderate Thinness |
| 17 - 18.5 | Mild Thinness |
| 18.5 - 25 | Normal |
| 25 - 30 | Overweight |
| 30 - 35 | Obese Class I |
| 35 - 40 | Obese Class II |
| Above 40 | Obese Class III |
BMI introduction
BMI is an index of body mass versus height, commonly presented as a number representing a person’s degree of leanness or corpulence. Its purpose is to quantify a greater or lesser mass of tissue. It is a general measure that is commonly considered for categorizing whether someone is at a healthy body weight for their height; in other words, it is a relative weight for height. The value calculated from BMI tells us the range that categorizes whether a person is underweight, normal weight, overweight, or obese. The BMI ranges tend to vary between regions or countries and sometimes they are further categorized into subcategories such as severely underweight or very severely obese. Whether a person is overweight or underweight might have a significant effect on health, so although BMI is not perfect for assessing healthy weight, it is an integral part of a medical evaluation that tells the clinician whether any further testing or action should be taken. Please see the table below for the categories related to BMI that would be used by the calculator.
BMI table for adults
This is the World Health Organization’s (WHO) recommended body weight based on BMI values for adults. It is used for both men and women, age 20 or older.
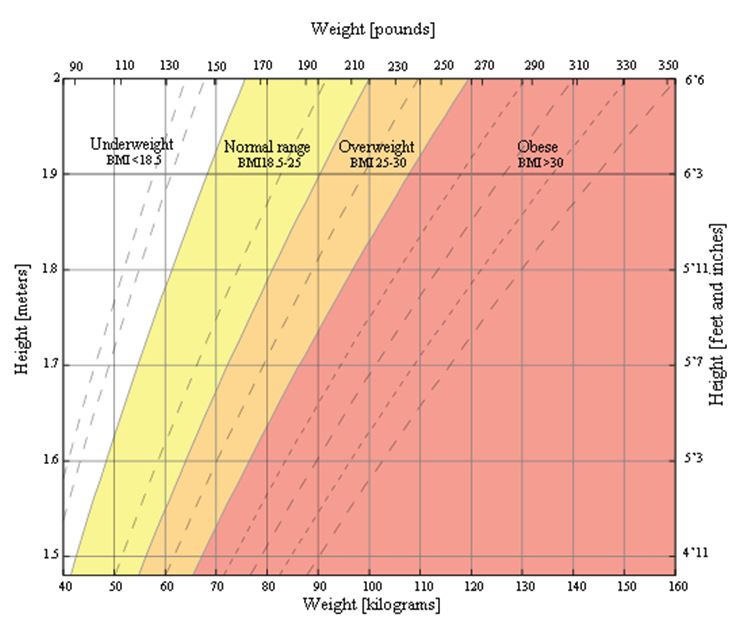
BMI chart for adults
This is a graph of BMI categories based on the World Health Organization data. The dashed lines represent subdivisions within a major categorization.
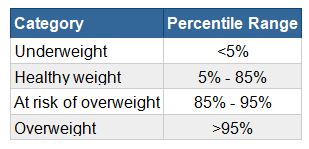
BMI table for children and teens, age 2-20
The Centers for Disease Control and Prevention (CDC) recommends BMI categorization for children and teens between age 2 and 20.
Dangers of being overweight Being
Being overweight raises the chances of developing a number of serious diseases and health conditions. Below is a list of these risks according to the Centers for Disease Control and Prevention (CDC)\
• High blood pressure
High levels of LDL cholesterol — which is usually regarded as bad cholesterol — low levels of HDL cholesterol – which is usually regarded as good cholesterol when at lower levels – and higher triglycerides
Type II diabetes
Coronary heart disease
Stroke • Gallbladder disease
Osteoarthritis – which is joint disease resulting from breakdown of cartilage in the joint
Sleep apnea and breathing problems
Certain cancers (endometrial, breast, colon, kidney, gallbladder, liver)
Low quality of life
Mental illness (clinical depression, anxiety, etc.)
Body pain and difficulty completing certain physical tasks
Generally, an increased risk of death compared to those with normal BMI
As can be seen in the long list above, being overweight can result in numerous negative health results, some of which can lead to death. In general, it is best practice to keep BMI as low as 25 kg/m2 — but a person should ideally consult a physician at some point in order assess whether or not changes are needed in order to be more healthy.
Associated Risks of Being Underweight
Being underweight carries its own associated risks, as outlined below:
Malnutrition, vitamin deficiencies, anemia (decreased capacity to transport red blood cells)
Osteoporosis, a disease that weakens bones and raises the risk of fracture
Decreased immune function
Growth and developmental disruptions, particularly in children and adolescents
Potential reproductive complications for women as a result of hormone disruptions that can affect the menstrual cycle. Women who are underweight also have an increased risk of miscarriage in the first trimester.
Potential complications after surgery
In many cases, a higher risk of death compared to people with a healthy BMI
In some cases, being underweight can be a sign of some underlying condition or disease, such as anorexia nervosa, which has a set of different risks. Talk to your doctor if you believe that you or someone you know may be underweight, especially if the reasoning for being underweight does not appear to be clear..
Limitations of BMI
Although BMI is a commonly used and useful estimate of healthy body weight, it does have limitations. BMI is an estimate and cannot consider body composition. BMI should be considered in conjunction with other measurements instead of being the only measure of a person’s healthy body weight, given the wide range of body types and distribution of muscle, bone mass, and fat.
In adults:
BMI is not a perfect measurement of body fat; it is a measurement of body weight excess – not a measurement of body fat excess. In addition to body weight, BMI is influenced by age, sex, ethnicity, amount of muscle, amount of body fat, activity level, and other factors. An older person at a healthy weight, who is inactive on a daily basis, has considerable amounts of body fat – even if weight is not high. In this scenario, the person is “unhealthy,” while a younger person, with appreciably higher muscle composition, reaches a healthy weight with the same BMI and age. Athletes, especially bodybuilders, are another example of BMI reporting overweight even when they are at a healthy weight for body composition (muscle is heavier than fat). The CDC concludes:
Older adults will generally have more body fat than younger adults at the same BMI
Woman will generally have more body fat than male with the same BMI
Muscular individuals and athletes who are highly trained may have a higher BMI because of muscle mass, compared to body fat.
In children and adolescents:
The factors that affect BMI effectiveness in adults also can apply to children and adolescents. Children’s height, along with puberty, can also impact BMI and body fat. BMI is usually a better indicator of excess body fat for obese children than for overweight children since BMI can either indicate increased fat mass or fat-free mass (e.g., water, organs, muscle, etc.) and presents as the same BMI. For thin children, the BMI difference from their peers may also be due to fat-free mass.
Ultimately, BMI is reasonably accurate as an indicator of body fat in 90-95% of the general population and can be appropriately combined with others measures to assist in determining an individual’s healthy body weight.
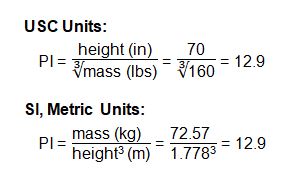
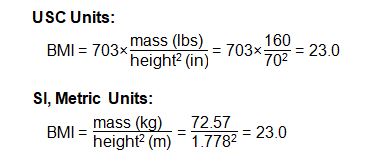
BMI formula
Below are the equations used for calculating BMI in the International System of Units (SI) and the US customary system (USC) using a 5’10”, 160-pound individual as an example:
BMI Prime
BMI prime is the ratio of a person’s measured BMI to the upper limit of BMI that is considered “normal,” by institutions such as the WHO and the CDC. Though it may differ in some countries, such as those in Asia, this upper limit, which will be referred to as BMIupper is 25 kg/m2.
The BMI prime formula is:
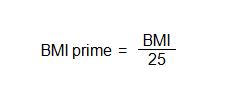
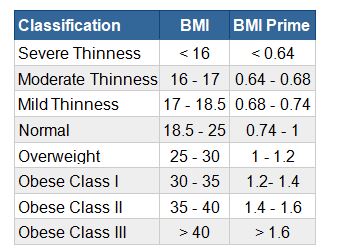
Since BMI prime is a ratio of two BMI values, BMI prime is a dimensionless value. A person who has a BMI prime less than 0.74 is classified as underweight; from 0.74 to 1 is classified as normal; greater than 1 is classified as overweight; and greater than 1.2 is classified as obese. The table below shows a person’s weight classification based on their BMI prime
Ponderal Index
The Ponderal Index (PI) shares similarities with BMI. Both indices aim to measure the leanness and corpulence of a person based on the relationship between weight and height. The key difference to note is that the PI cubed the height while the BMI is squared (both calculations provided underneath). The BMI can be a useful statistic when thinking about large populations, but it cannot be trusted at an individual level to appropriately quantify leanness or corpulence in individuals. Even with these large population considerations, PI suffers similar short-comings, but it is more accurate to use with tall or short individuals, while BMI tends to record bizarrely high or low levels of body fat for those in the extreme ends of the physical height and weight continuum. Below is the equation for calculating the PI of an individual when using USC, using a person who is 5’10” and weighs 160lbs as an example: